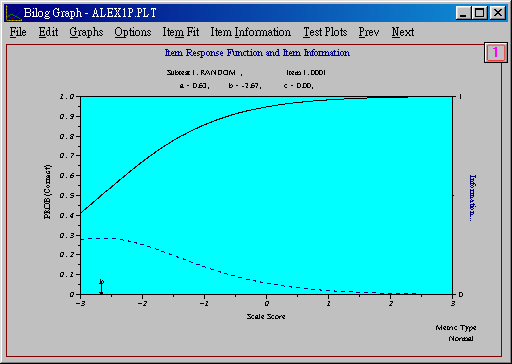
SAS does not have built-in procedures to run Rasch measurement model, item response theory analysis and to visualize Item Characteristic Curves (ICCs). Although Winsteps could run Rasch model analysis and Bilog could display ICC item by item, Winsteps have ASCII-type graphs only and Bilog does not overlay the ICCS of all items in one graph. In addition, these graphics are static and thus they do not allow interactive exploration such as linking fit statistics with the ICC.
To rectify this situation, a Perl script is written to automate the visualization by integrating the functionality of three different statistical programs. However, it is important to note that the script is written for parsing data for a specific file format. The script must be modified before it can be applied to different settings. The perl script can perform the following functions:
- Read a raw data file and output the cleaned data and the key.
- Run Winsteps in the batch mode.
- Run Bilog programs with one, two, and three parameters in the batch mode, and extract the phase1, phase2, and phase3 data for each parameter from Bilog output. If the test includes field test items, Bilog-Multiple Group (MG) will be run instead.
- Run a SAS program in the batch mode with phase1, phase2, and phase3 data for each parameter, compute the curve height for each ICC, depending upon the estimated theta, and write all data to a space-delimited text file, which can be opened in DataDesk or Excel.
- The SAS program outputs a frequency table of option X ability for distratcor analysis. The output will be in both XXX.lst and XXX.html (XXX is the file name chosen by the user).
- Generate an html file as a front end interface for the subject experts to view or download different output files via the internet.
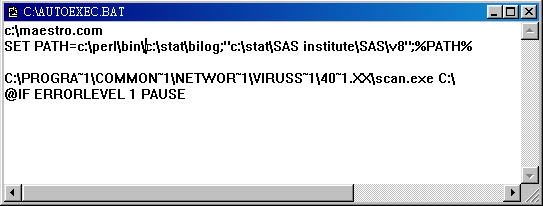
Because the Perl script will write three Bilog programs and a SAS program upon execution, the files "template.blg," "sastemplate.sas," and "final.perl" must be in the same directory. In addition, it is better to set the view in Windows as Arrange icons by date so that the last two result files can be seen easily.
Description of Winsteps
Winsteps is a program designed for Rasch scaling, which is equivalent to the one-parameter IRT model. However, the developers of Winsteps assert that equating Rasch scaling to item response theory or logit-linear models is a misclassification. Item response theory and logit-linear models describe data, but Rasch scaling specifies how persons, probes, prompts, raters, test items, and tasks must interact statistically for linear measures to be constructed from ordinal observations.
Several output tables of Winsteps are very helpful. For example, the map of students and items illustrates the tester ability and the item difficulty side by side. Using this table, the test developer gains a descriptive picture of the test at one glance. In addition, Winsteps could output the item statistics, the subject statistics, and the residual statistics. The item statistics could be used to determine which items are poorly written. The subject statistics reports the estimated ability (theta) of each tester and the residual statistics indicates the degree of fit between the model and the data.
Description of Bilog
Unlike Winsteps, Bilog is capable of running one-, two-, and three-parameter models. The Perl script runs Bilog with all three models in the batch mode, and then extracts the phase 1, phase 2, and phase 3 data for each parameter from the Bilog output.
- Phase 1 output includes the classical item analysis data such as item difficulty in terms of percentage of correct responses, logits, Pearson coefficients, and bi-serial coefficients.
- Phase 2 output includes item characteristic curve (ICC)'s parameters such as the low asymptote, the slope, the threshold, and the chi-square statistics.
- Phase 3 output includes the estimated theta (ability) of each examinee.
Running Bilog in the batch mode is tricky. The syntax is:
blgwin filename 250000 20000 0
- Use blgwin instead of bilogw. Also, you should omit the extension ".exe" while executing the command.
- Although the program file has .blg extension, do not include ".blg" in the file name.
- Allocate more memory to the batch process. 250000 is for numeric and 20000 is for character.
4. Use "0" to run all phases--phase1, phase2, and phase3. Use 1, 2, 3 will pause the execution.
In addition, although Bilog has the ability to output text files for saving computed results, some statistics are available in the phase files only. For example, although both the Phase 2 output and the parameter file (.PAR) contain the a, b, c parameters, chi-square and degree of freedom are in the Phase 2 output file only.
Description of Bilog-MG
When field test items are inserted into multiple forms, another Perl script is employed to run Bilog-Multiple Group (MG) to analyze the data. Field test items are new items and thus their psychometric properties are unknown. These items are inserted into real examinations but scores of these items are not counted toward the final grade of testers. Because only a small number of field test items are presented along with non-field-test items, multiple forms are needed to accommodate testing of these new items. For example, when forty new items are released, four alternate forms are used and ten field test items are included in each form. Field test items are analyzed as a subset and reliability in terms of alternate forms is estimated. Initially the research team experimented with Bilog for multiple-form analysis. However, it is difficult for Bilog to accept multiple keys and thus Bilog MG was adopted for this specific task.
Before running the perl script
If the folder name contains space, you must use a pair of quotation marks to bracket the path. Then reboot your computer. You just do this once. To verify that the path is set correctly, open a command prompt session and type path. The preset path upon boot up should be displayed.
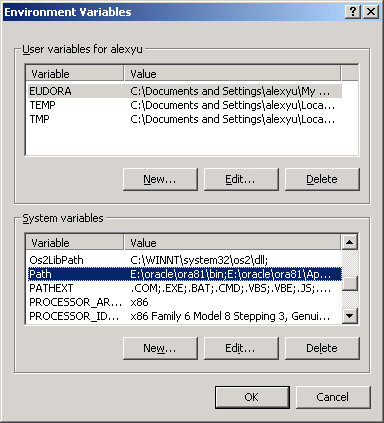
Another way to definne the path is through the environment variable in the system control panel:
- Go to Settings from the Start Menu.
- Open the control panel.
- Open System.
- Select the tab Advanced.
- Click on Environment variables.
- Scroll down the bottom scroll down list and select path.
- Edit the path.
How to run the perl script
- Put the raw data file in the same directory. Usually the raw data has a very long file name. Rename it to something short, such as "test1."
- Double-click "final.perl." If it is your first time to run Perl, you will be prompted to choose a program association. Choose "ActivePerl" and from now on you can run any Perl script by double-clicking.
- A command prompt session will open. You will be asked to enter the raw data file name. Enter the file name and press ENTER.
- You will be asked to type an output name without an extension (e.g. txt, dat). It is important because Bilog will not run in the batch mode if the file has a dot and a three-letter extension. Choose a simple name.
- The final product is named XXX_results (XXX is the name you chose).
- The file XXX.lst has the frequency table of option X ability.
How to create ICC graphs in DataDesk
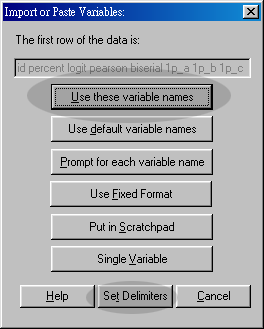
- Drag the XXX_results icon to the DataDesk icon, or Open DataDesk and then open XXX_results
- Set delimiter to space.
- Choose Use these variable names
- Select the columns that represent the data (e.g. from 1p-5 to 1p+5)
- Select Dot plot side by side from Plot
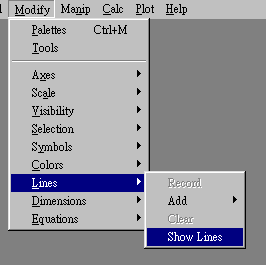
- Select Modify--Lines--Show Lines
- Select the column that represents fit statistics
- Choose Dot plot side by side from Plot
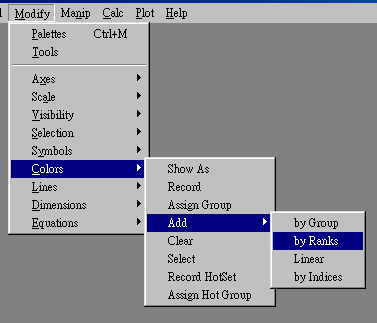
- Select the points in the fit statistics graph. Go to Modify--Color. Then select Add color by rank. The fit statistics and the ICC graph would be linked together.
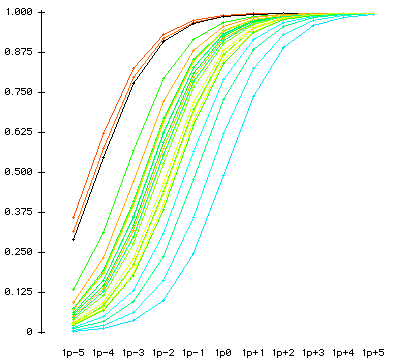
The following are examples of ICC graphs
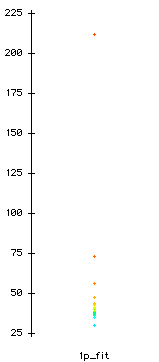
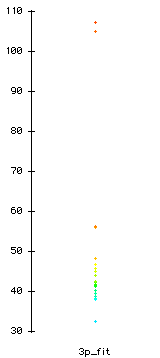
Fit statistics and ICC of one-parameter model
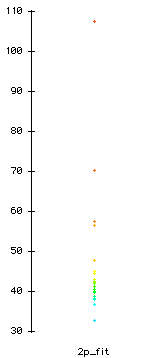
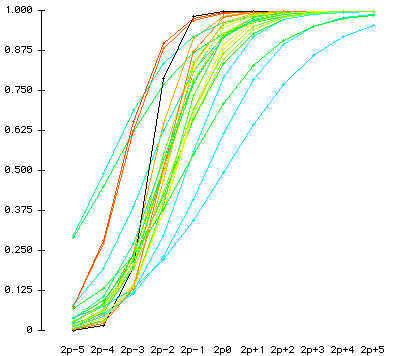
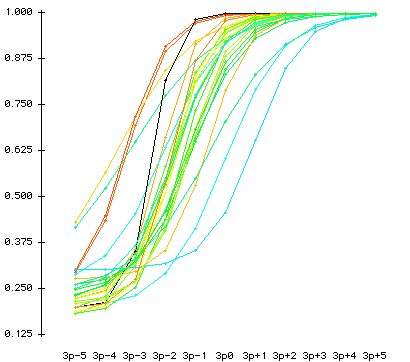
Fit statistics and ICC of two-parameter model
Fit statistics and ICC of two-parameter model
The following is an option X ability table found in XXX.lst. "1," "2," "3," and "4" stand for multiple choices "a," "b," "c," and 'd". The column labels represent the estimated thetas. It is important to note that the column percentage (highlighted by green bars) is the focus of interest.
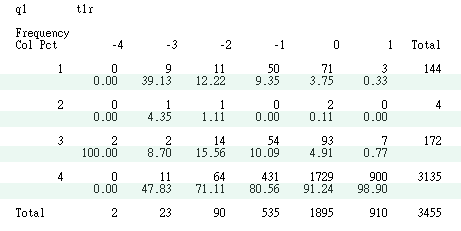
The following is the same table presented in XXX.html.
|
|
| Table of q1 by t1r |
| q1 |
t1r |
Total |
| -4 |
-3 |
-2 |
-1 |
0 |
1 |
| 1 |
0
0.00 |
9
39.13 |
11
12.22 |
50
9.35 |
71
3.75 |
3
0.33 |
144
|
| 2 |
0
0.00 |
1
4.35 |
1
1.11 |
0
0.00 |
2
0.11 |
0
0.00 |
4
|
| 3 |
2
100.00 |
2
8.70 |
14
15.56 |
54
10.09 |
93
4.91 |
7
0.77 |
172
|
| 4 |
0
0.00 |
11
47.83 |
64
71.11 |
431
80.56 |
1729
91.24 |
900
98.90 |
3135
|
| Total |
2 |
23 |
90 |
535 |
1895 |
910 |
3455 |
|
Navigation
Index
Simplified Navigation
Table of Contents
Search Engine
Contact