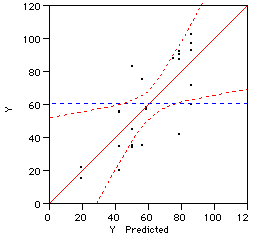
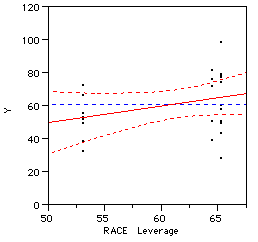
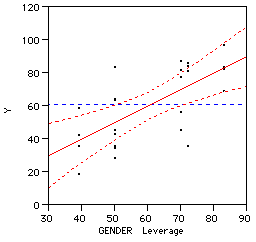
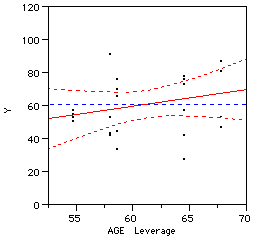
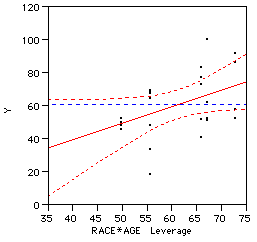
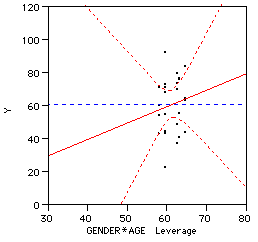
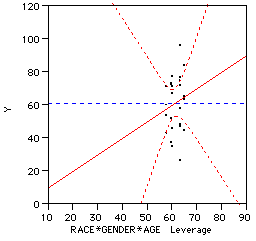
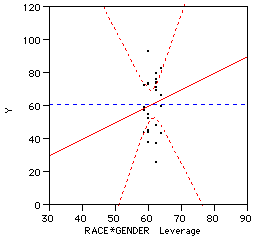
Leverage Plot for F-test
Visualization of confidence intervals can be applied to F-test by using a leverage plot. The following figures show an example of a hypothetical 2 * 2 * 2 factorial design. The outcome variable is labelled as Y whereas the three factors are race (White, Black), gender (male, female) and age (young, old). The eight panels shows the overall test, main effects, and interaction effects, respectively. Each panel displays the mean as a horizontal line, the actual values of Y, the predicted values of Y, a regression line, and a 95% CI. The significance of each effect is indicated by the CIs and the mean--when the CI crosses the mean line, it signifies a significant effect. In this example, there is a significant gender effect while the other main effects and interaction effects are not significant.
Note: You can also use a simple tool, such as Excel, to
visualize the main effect and the
interaction effect.
|