How to use Illustrator to create a presentation poster
|
Chong Ho Yu, Ph.D. |
This is a brief illustration of using Adobe Illustrator to create a presentation poster for conferences. The illustration is based on the assumption that you have access to a large format plotter, which can output file size up to 3 feet by 4 feet.
Illustrator is ideal for creating this kind of large format output because it is a vector-based graphic program. Unlike a pixel-based program, the graphic in a vector-based program is defined by geometric relationships rather than picture elements (pixels, dots). The appearance of the graphic is rendered by algorithms on the fly when it is resized, thereby the resolution is not degraded even though the output is a poster. However, you may still need several pixel-based graphics that cannot be generated in Illustrator. Thus, it is likely that your poster consists of both vector-based and pixel-based pictures.
To make a poster, please follow the procedures below :
Prepare the background
You can put a background image on the poster to highlight the theme.- In order not to distract the main body, the background color must be very light. Use
the transparent setting in PhotoShop to make it light.
- The size of the background image should be around 16 inches by 12 inches.
- The DPI should be 100.
Prepare the text
- The text can be typed in any word processor, but the output should be saved in the Rich Text Format (RTF).
- The text length should be about 3-4 pages.
- The font size should be 9-10 points. Please keep in mind that the Illustrator file will be printed as 300% as a poster. Thus, 10-point fonts on screen will be 30-point fonts on the poster.
Prepare the graphics
Some graphics are difficult, if not impossible, to be created in Illustrator. Thus, you may still need pixel-based images. For example, statistical charts can be made easily in SPSS, Excel, DataDesk...etc.
After creating the charts in a statistical application, create a new file with 600 DPI in PhotoShop, then paste the chart into the new file and save it in TIFF. When you import the chart into Illustrator, probably resizing is necessary. If you enlarge the picture 200% in Illustrator, the DPI will decrease 200% to 300 DPI. When the Illustrator file is printed to 300%, the DPI of the graphic will further dropped 300% to 100 DPI. Therefore, 600 DPI in PhotoShop is the minimum. If your computer has enough RAM, make it to 1200 DPI.
Document setup
When the background, the text, and the figures are ready, start Illustrator:
- Open Document setup under File.
- Select Custom for size and Inches as Unit.
- Enter the width as 16 inches and the height as 12 inches
- Change the orientation to Landscape and do the same in Page Setup.
- Change the dot per inch (DPI) to 300.
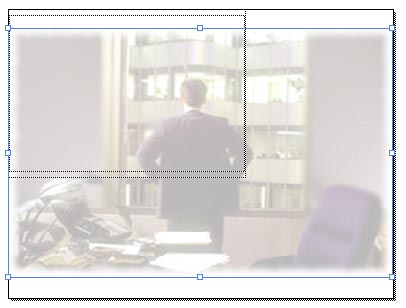
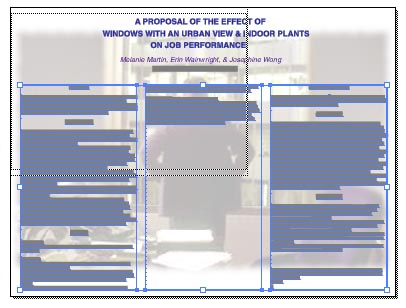
Import the background
The inner frame shows the printable area of your current printer. Ignore it if your default printer is a regular printer rather than a large format plotter. The outer frame is your usable area.
- Import the background by selecting Place from File.
- To move the background, use the pointer from the tool box to select the graphic and adjust its position.
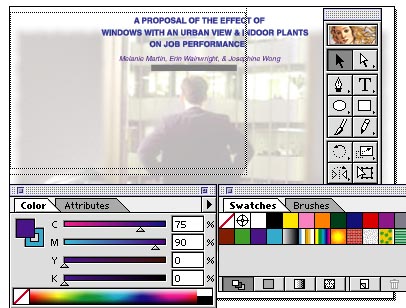
Create the header
- From Type select font and size for the header. Twenty-four-point is recommended. The actual size on the poster will be 72 points (24 X 2).
- Select the icon T from the tool bar, click on the canvas and start typing. There is no text-warp. You should type the header into separate lines by re-clicking the T icon.
- To change the color, choose a hue from Swatches.
- To re-position the header, use the pointer from the tool box, click on the header and move it. If you want to select and move several lines at once, hold down the shift key while selecting.
Import the text
- Choose Place from File to import the text.
- Adjust the text box size and re-position it.
- You may need multiple columns rather than one column. To create several more columns in the same size, choose View from Artwork.
- From the tool box, select the pointer with an white arrow and a plus sign.
- Select the text box, hold down the option key, and drag the column to make a copy.
- If you need another column, choose Object--Transform--Transform Again.
- Go back to Preview from View.
- Choose the pointer with an black arrow and select all columns by holding down the shift key.
- From Type, choose Block -- Link. All columns will be linked and the text will flow from one to another.
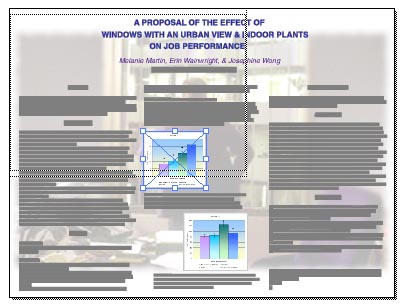
Import the graphics
- Choose Place from File to import the charts.
- The charts may look very small. Drag the corner of the chart to enlarge it. If you want to keep it in proportion, hold down the shift key while resizing.
Proof
Now the poster is ready to go. But before you send it to the plotter, you should make sure that it looks fine by doing the following:- From View zoom in the poster to 300%. This will be what the text and the graph look like on the hard copy.
- Print a smaller proof-print first.