Meta-analysis and effect size
Power analysis and meta-analysis
The previous lesson mentioned that power is a function of
effect size, alpha level and sample size. What is effect size? How is
it related to power analysis? How can we determine effect size? Answers
to these questions are provided below. It is important to point out
that although power analysis requires the effect size yielded from
meta-analysis, meta-analysis does not rely on power analysis. This
could be a standalone method in its own right.
"Meta" is a Greek prefix meaning "after" or "beyond." Meta-analysis (MA)
is a secondary analysis after other researchers had done their own
analyses and the meta-analyzer can go beyond what had been accomplished
in the past. Simply put, MA is analysis of analyses. Even if you might
never done MA before, you have already done quasi-meta-analysis,
namely, literature review, which is typically presented in the
following way:
- According to So and So (2009), Program X can effectively reduce the risk of colon cancer.
- Smith and Smith (2010) found that patients were unresponsive to Treatment X. It is a waste of your money.
- Prior research found that the therapeutic effect of Program X is minimal (Doe and Doe, 2014).
What can be done with the preceding heterogeneous or even
contradictory findings? The answer is: One must go beyond literature
review by looking into MA and effect size.
What is effect size?
Before discussing the effect size, I would like to introduce a broader concept: comparison in terms of a standard.
Many statistical formulas seem to be difficult to follow. Indeed, many of them
are nothing more than a standardized comparison. Take comparing wealth
as a metaphor. How could we compare the net assets of American IBM
corporation and Japanese Sony corporation? The simplest way is to
compare them in US dollars, the standard currency for international
trade. By the same token, a t-test is a mean comparison in terms of the
standard deviation. Many statistics follow this thread of logic.
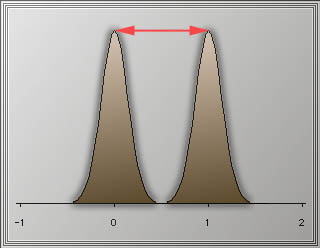
Effect size can be conceptualized as a standardized difference.
In the simplest form, effect size, which is denoted by the symbol "d",
is the mean difference between groups in standard score form i.e. the
ratio of the difference between the means to the standard deviation.
This concept is derived from a school of methodology named Meta-analysis, which was developed by Glass (1976).
P value: Not zero!
Conventionally researchers draw a conclusion based on the p value alone. If the p value is less than .05 or .01, the effect, difference, or relationship is believed to be significant. The p
value, by definition, is the probability of correctly rejecting the
null hypothesis (no effect, no difference, or no relationship) assuming
that the null is true. However, is it sufficient? Consider the
following scenarios:
- When the US President asks a four-star general to estimate the
potential casualty of a possible war, he replies, "Not zero. Some
soldiers will die."
- Your boss wants you to give a raise and asks you how much you expect, you answer, "Not zero. I deserve more compensation."
- After you have gone through a rigorous fitness program, your
wife asks you how much weight you lost. You answer, "Not zero. I lost
a few pounds."
Do you think the above are satisfactory answers? Of course,
not. However, this type of answer is exactly what we can get from
conventional hypothesis testing. When the null hypothesis is rejected,
at most the conclusion is: "The null hypothesis is false! Not null! The
effect, difference, or correlation is not zero." The p value tells you
how unlikely the statistics can be observed in the long run by chance
alone; it says nothing about the degree of treatment effectiveness, the
magnitude of the association, or the distance of the performance gap.
The following figure shows that the difference, indicated by red
arrows,
can be anything.
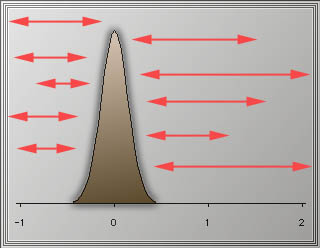
Researchers should be concerned with not only whether a null hypothesis
is false or not, but also how false it is. In other words, if the
difference is not zero, how large should the difference be expected? By
specifying an effect size, which is the minimum difference that is
worth research attention, researchers could design a study with optimal
power rather than wasting resources on trivial effects. The larger the
effect size (the difference between the null and alternative means) is,
the greater the power of a test is.
Ideally, power analysis employs the population effect size. However, in practice the effect size must be estimated from sample data.
How can we determine effect size?
Gene Glass's approachThere are several ways to calculate
effect size. The three most popular approaches are Gene Glass's
approach, Hunter-schmidt's approach, and Cohen's d. The basic formula
of Glass's approach is:
| Mean of control group - Mean of treatment group |
| ______________________________________________________ |
Standard deviation of the control group |
The control group's standard deviation is used because it is not affected by the treatment (Glass, McGraw, & Smith, 1981).
Hunter-schmidt's approachHunter and Schmidt (1990)
suggested using a pooled within-group standard deviation because it has
less sampling error than the control group standard deviation under the
condition of equal sample size. In addition, Hunter and Schmidt
corrected the effect size for measurement error by dividing the effect
size by the square root of the reliability coefficient of the dependent
variable:
| Effect size |
| Measurement error correction = | ___________________________ |
|
Square root of r |
Concepts of measurement error and reliability coefficient will be discussed in the section "Measurement."
Cohen's d
When there are two independent groups (e.g. control and treatment), Cohen's d
can be obtained by the following formula:
| Treatment group mean - Control group mean |
| ________________________________________________________ |
SQRT(Treatment group variance + Control group variance)/2) |
When a study reports a Chi-square test result with one degree of freedom (n=2),
the following formula can be employed to approximate Cohen's d:
abs(d) = 2*SQRT(Chi-square/N - Chi-square)
where N is the total sample size
When a study reports a hit rate (percentage of success after taking the
treatment or no treatment), the following formula can be used:
d = arscine(p1) + arscine(p2)
where p1 and p2 are the hit rates of the two groups (e.g. control and treatment)
(Poston & Hanson, 2010) Conventional values
The conventional values of effect size (Cohen, 1962) are:
| Small | d = .20 |
| Medium | d = .40 |
| Large | d = .60 |
Other researchers may have different values for small, medium, and
large effect size. The magnitude of effect size depends on the subject
matter. For example, in medical research d = .05 may consider a large
effect size i.e. if the drug can save even five more lives, further
research should be considered.
It is important to point out that Cohen defined .40 as the medium effect size
because it was close to the average observed effect size based on his literature
review using Journal of Abnormal and Social Psychology
during the 1960s. The so-called small, medium, and large effect sizes
are specific to a particular domain (abnormal and social psychology)
and thus they should not be treated as the universal guideline
(Aguinis, & Harden, 2009).
Because different subject matters might have different effect sizes,
Welkowitz, Ewen, Cohen (1982) explicitly stated that one should not use
conventional values if one can specify the effect size that is
appropriate to the specific problem. Moreover, Wilkinson and Task Force
(1999) gave the following advice, "Because power computations are most
meaningful when done before data are collected and examined, it is
important to show how effect-size estimates have been derived from
previous research and theory in order to dispel suspicions that they
might have been taken from data used in the study or, even worse,
constructed to justify a particular sample size."
It is a common practice for researchers to collect articles in their fields and catalog them in
EndNote for future citation. It may be more beneficial to use
this collection to calculate and constantly update the effect size of
the subject matter to be studied.
In practice, it may be difficult to find past research studies related
to your topic, especially when the topic is fairly new. To rectify this
situation, Glass, McGraw, and Smith (1981) suggested looking at studies
in similar domains. For example, if you are not able to locate enough
research papers on big data ethics, you can use studies on data ethics or general ethical concerns in research.
It is noteworthy that not all research studies can be included in your
collection for meta-analysis. Only well-designed studies which conform
to the standards established by Campbell and Stanley (1963) and Cook
and Campbell (1979) should be considered. Criteria of well-designed
studies will be discussed in the section "Design of experiment"
Applications of meta-analysis
As discussed in the section concerning power analysis,
computing effect size is essential to sample size determination.
Nevertheless, meta analysis can not only be used for synthesizing
results of past research, but also for new research studies. For
example, Baker and Dwyer (2000) conducted eight studies regarding
visualization as an instructional variable (n=2000). If all subjects
are used for one analysis, the study will be over-powered. Instead, the
effect size is computed in each study individually. The findings of
eight studies are pooled to draw inferences as to the meaning of a
collective body of research.
Besides the risk of overpowering, using all data in one test may lead
to the Simpson's paradox. Simpson's Paradox is a phenomenon in which the
conclusion drawn from the aggregate data is opposite to the conclusion
drawn from the contingency table based upon the same data.
The following example is given by Schwarz (1998). A university
conducted a study to examine whether there is a sex bias in
admission. The admission data of the MBA program and the law school
were analyzed. The first table shows the MBA data:
|
|
MBA Program
|
|
|
Admit
|
Deny
|
Total
|
|
Male
|
480 (80%)
|
120 (20%)
|
600 (100%)
|
|
Female
|
180 (90%)
|
20 (10%)
|
200 (100%)
|
By looking at the MBA data only, it seems that females are
admitted at a slightly higher rate than males in the MBA program. The
same pattern can be found in the law school data.
|
|
Law School
|
|
|
Admit
|
Deny
|
Total
|
|
Male
|
10 (10%)
|
90 (90%)
|
100 (100%)
|
|
Female
|
100 (33%)
|
200 (66%)
|
300 (100%)
|
Interestingly enough, when the two data sets are pooled, females
seem to be admitted at a lower rate than males!
|
|
MBA and Law
School
|
|
|
Admit
|
Deny
|
Total
|
|
Male
|
490=70%
|
210=30%
|
700 (100%)
|
|
Female
|
280=56%
|
220=44%
|
500 (100%)
|
Another well-known example of the Simpson’s Paradox is the myth of the
decline of averages the Scholastic Aptitude Test (SAT) scores. From 1972 to
1992, the combined math and verbal scores on SAT dropped from an
average of 937 to 899, resulting in widespread criticisms against the
US education system. Indeed, what really happened is that more and more
students took the SAT. Although the aggregated scores were falling, the
scores were improving for every subgroup (by gender, race, school
type, parent’s education level, SES…etc.) (Rothstein, 1993; O’Neil,
2016).
To avoid the Simpson Paradox, Olkin (2000) recommends researchers to
employ meta-analysis rather than pooling. In pooling, data sets are
first combined and then the groups are compared. In meta-analysis,
groups in different data sets are compared first and then the
comparisons are combined.
This “divide and conquer” strategy is also known as
the Split/Analyze/Meta-Analyze (SAM) approach. In the previous example the
data set is partitioned by logical categories (e.g. school or college).
When there is no obvious way to split the data, Cheung and Jak (2016)
recommended partitioning the data randomly if the data set is very big.
Next, these data are analyzed as separate studies and at the end all
these results are combined by meta-analysis.
Merits of meta-analysis
- A single study might lack statistical power due to a small sample
size. Nevertheless, when many prior studies are combined together, statistical power increases.
- An individual study might over-estimate or under-estimate the effect size. Again, when many studies are pooled together, the precision of the estimation can be substantially improved.
- A single study might have a very narrow focus. Meta-analysis can answer questions not posed by those scattering studies.
- When diverse or even conflicting results are found in previous studies, a meta-analyst is able to resolve the dispute
by looking at the forest instead of the trees. However, the
meta-analyzer must take variation across studies into account (Higgins
& Green, 2008).
Limitations of meta-analysis
Ioannides (2016) criticized that meta-analysis implemented
in biomedical science is often "redundant, misleading, and conflicted"
(p.485). Like every methodology, meta-analysis also has certain
limitations and weaknesses:
Assumption of standardized effects
It is important to point out that in some branches of meta-analysis
computation of effect size is based upon a pooled variance or an
adjusted variance. In response to this practice, Berk and Freedman
(2003) are skeptical of the merit of meta-analysis. In their view, the
claimed merit of meta-analysis is illusory. First, many meta-analyses
use studies from both randomized experiments and observational studies.
In the former, it is usually the case that subjects are not drawn at
random from populations with a common variance. In observational
studies there is no randomization at all. Thus, it is gratuitous to
assume that standardized effects are constant across studies.
While this criticism is valid to some degree, the shortcoming can be
easily fixed by setting a higher bar in the inclusion and exclusion
criteria. For example, in the meta-analysis regarding the effect of
intercessory prayer on the effectiveness of social workers, Hodges
(2007) included only randomized controlled trials. Studies that used
less rigorous designs, such as single-case studies and non-randomized
studies, were excluded. In a similar study, Thompson (2007) started
with 150 potential candidates but at the end only 23 studies that
employed true experiments were retained in his meta-analysis.
Retrospective observational studies that were designed as
quasi-experiments were removed from his meta-analysis.
Social dependence
Further, Berk and Freedman (2003) questioned the assumed independence of
studies for meta-analysis. Researchers are trained in similar ways,
read the same papers, talk to each other, write proposals for the same
funding agencies, and publish the findings to the same pool of
peer-review journals. Earlier studies lead to later studies in the
sense that each generation of doctoral students trains the next. They
questioned whether this social dependence compromises statistical
independence.It
is true that in some cultures the mentees tend to follow the exact
footstep of the mentor. In this case, close relationships among
researchers might be a threat against the validity of meta-analysis.
Nonetheless, today it is very common for researchers to think
independently and to challenge each other. As a matter of fact,
divergence, instead of conformity, is the norm of the academic
community.
Publication bias
Another common problem of meta-analysis is publication bias, also known
as the file-drawer effect (today
we should call it "hard-drive effect" because we store our manuscripts
digitally): Publication bias leads to the censoring of
studies with non-significant results. As a remedy, Keng and Beretvas
(2005) developed a methodology to quantify the effect that publication
bias can have on correlation estimation. The most common methods to
check publication bias are funnel plots and Egger's test (Steme &
Egger, 2001).
In response to this challenge, Schmidt and Hunter (2015) counter-argued
that publication bias is only one of many sources of research biases.
Other sources include researcher's personal bias, sampling error,
confirmation bias, and reviewer bias.
To minimize possible bias, one can purposefully look for unpublished research studies,
such as dissertations, theses, and conference presentations. One can go
even further by soliciting unpublished manuscripts from researchers in
the field (e.g. Stajkovic & Lee, 2001).
Logic of the courtroom
Root (2003) challenged the merits of meta-analysis at the philosophical
level. According to Root, standard hypothesis testing is based upon the
logic of physical sciences, in which the researcher must gamble with
the unknown future,
in the sense that the prediction derived from the hypothesis may not be
in alignment to the proposed theory. However, meta-analysis is
implicitly tied to the logic of the courtroom, in which collected evidence
is used to explain past events. In a retrospective methodology
such as meta-analysis, the synthesizer has the luxury of choosing what
past studies to be included. Using gambling as an analogy, Root pointed
out that computing probabilities based on known facts is like betting
money in a game after the result is known. Subjective selection
The result of meta-analysis is tied to the selection criteria set by the
researcher. For example, while Smith, Glass and Miller's (1980) meta-analysis showed a positive effect
of psychotherapy, Prioleau, Murdoch and Brody (1983) produced a different
conclusion. In an attempt to resolve the debate concerning whether mammography
can reduce the mortality rate of breast cancer, a research team utilizing
meta-analysis found that there was no reliable evidence to support the claim
that mass screening for breast cancer had a positive effect for any women. On
the contrary, the US Preventive Service Task Force that employed meta-analysis,
too, concluded that use of mammograms significantly enhanced the survival rate of
women from 40-74 years of age. Aschengeau and Seage III (2007) asserted that the
preceding contradiction is a result of different criteria for selecting the
literature.
Nonetheless, discrepancy occurs in many studies utilizing
other methodologies. If one rejects meta-analysis on this ground, then
one should also be opposed to almost all methodologies.
Superrealization bias
"Superrealization bias," the term coined by Cronbach et al. (1980) is germane
to effect size and meta-analysis. Superrealization bias refers to the phenomenon
that in a small-scale study, experimenters are able to monitor the quality of
implementation or create unrealistic conditions, but these ideal conditions
could never be realized on a large scale study. Slavin (2008), and Slavin and
Smith (2008) asserted
that small studies are not inherently biased, but a collection of small studies
tend to be biased. Thus, Slavin warned against reporting average effect sizes
using a cluster of low n studies.
Varying conditions across studies
It is important to point out that quite a few controversial conclusions in
medical research arise from meta-analyses. For example, based on meta-analyses,
the medical research community asserted that antidepressants are not more
effective than placebos. But critics charged that not all the studies included
in the meta-analyses used the same protocols, definitions, types of patients and
doses. The alleged safety of Avandia is another example. A meta-analysis from
the combined trials showed that only 55 people in 10,000 had heart attacks when
using Avandia whereas 59 people per 10,000 had heart attacks in comparison
groups. However, after a series of statistical manipulations, this conclusion
was reversed. It was argued that a meta-analysis synthesizing many small-scale
studies is not a good substitute for a single trial with a large sample size
(Siegfried, 2010).
No scientific breakthrough was made through meta-analysisSohn
(1995, 1996, 1997) questioned whether meta-analysis, as a form of
literature review, can be a good tool for scientific discovery. In a
similar vein, Skeptics and New Atheism authors tried to discredit
meta-analysis
because this method was used for studying supernatural and paranormal
phenomena. For example, Stenger (2007) wrote:
This procedure (meta-analysis) is highly
questionable. I am unaware of any extraordinary discovery in all of
science that was made using meta-analysis. If several, independent
experiments do not find significant evidence for a phenomenon, we
surely cannot expect a purely mathematical manipulation of the combined
data to suddenly produce a major discovery. No doubt parapsychologists
and their supporters will dispute my conclusions. But they cannot deny
the fact that after one hundred and fifty years of attempting to verify
a phenomenon, they have failed to provide any evidence that the
phenomenon exists that has caught the attention of the bulk of the
scientific community. We safely conclude that, after all this effort,
the phenomenon very likely does not exist (Kindle Locations 824-830).
In a similar vein, the Skeptic's Dictionary (2012) website defines meta-analysis as the following:
A meta-analysis is a type of data analysis in
which the results of several studies, none of which need find anything
of statistical significance, are lumped together and analyzed as if
they were the results of one large study.
Is the above the correct definition of meta-analysis? Is it a common
practice that a meta-analyst puts together the results from studies
that show no significant effects and then "mathematically manipulate"
the data to prove a point? Did the illustration of the Simpson's
Paradox clearly indicate that it is possible to yield opposite
conclusions when one analysis combines all data and the other one
partitions the data set? In response to Stenger's attack, Bartholomew
(2011) replied that it is not sure what the words “mathematical
manipulation” and “suddenly” mean. The so-called manipulation in
meta-analysis is no more mathematical than other statistical
procedures, such as hypothesis testing. When the criticism, no matter
how sophisticated it sounds, is misguided by the wrong definition and
poor statistical knowledge, it is nothing more than attacking a straw
man (Yu, 2012)
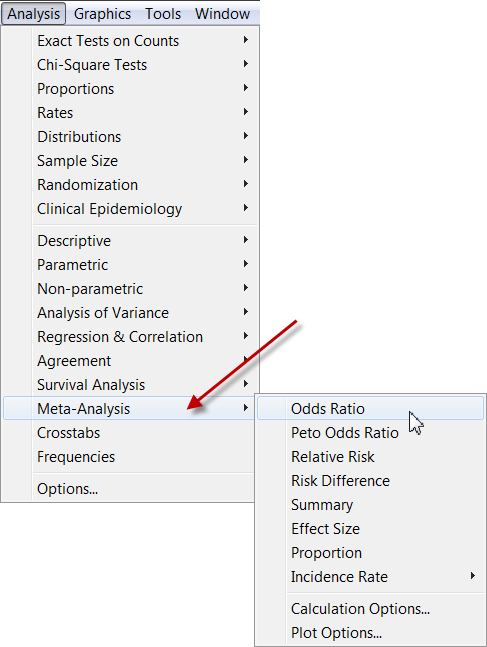
Software for meta-analysis
You can use either all-purpose stat programs or specialized programs to
conduct meta-analysis. SAS is an example of all-purpose stat programs
that can perform meta-analysis (Wang & Bushman, 1999). For
specialized programs, one can use BioStat (2017) or Devilly (2005). On
one hand StatDirect (2014) is considered an all-purpose stat
application because it can perform meta-analysis as well as other
statistical procedures, but on the other hand it can also be viewed as
a
specialized package because its features are made for biomedical,
public health, and epidemiological research. The image below is a
screenshot of StatDirect.
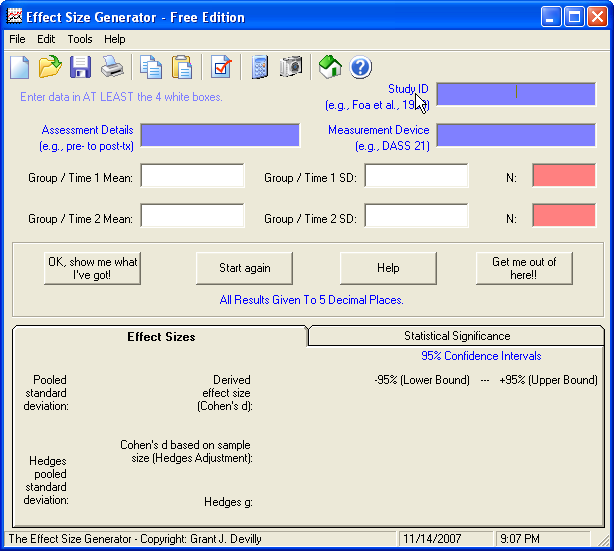
The following is a screenshot of Effect size Generator written
by Grant Devilly:
Further reading
To get a quick overview of effect size, I recommend reading a book chapter on effect size written by Tatsuoka (1993) in A Handbook for data analysis in the behavioral sciences (pp. 461-479), edited by Gideon Keren, Charles Lewis and published by Hillsdale, N.J. : L. Erlbaum Associates.For learning the procedure of conducting meta-analysis, please look at
Liao (1998) as an example.
Reference
- Aguinis, H. & Harden, E. E. (2009). Sample size rules of thumb: Evaluating
three common practices. In Charles E. Lance and Robert J. Vandenberg. (Eds.),
Statistical and methodological myths and urban legends: Doctrine, verity and
fable in the organizational and social sciences (pp.267-286). New York :
Routledge.
- Aschengrau, A., & Seage III, G. (2007). Essentials of epidemiology in
public health. Boston, MA: Jones and Bartlett.
- Baker, R., & Dwyer, F. (2000 Feb.). A meta-analytic assessment of the effects of visualized instruction. Paper presented at the 2000 AECT National Convention. Long Beach, CA.
- Bartholomew, D. (2010). Victor Stenger’s scientific critique of Christian Belief. Science and Christian Belief, 22, 117-131.
- Berk, R.A. & Freedman, D. (2003). Statistical assumptions as empirical commitments. In T. G. Blomberg, S. Cohen (Eds.). Law, Punishment, and Social Control: Essays in Honor of Sheldon Messinger (2nd ed) (pp. 235-254). New York: Aldine.
- Biostat (2017). Comprehensive Meta-Analysis. [Computer Software] Englewood, NJ: Author. Available: http://www.meta-analysis.com/
- Campbell, D. & Stanley, J. (1963). Experimental and quasi-experimental designs for research. Chicago, IL: Rand-McNally.
- Cheung, M., & Jak, S. (2016). Analyzing big data in
psychology: A Split/Analyze/Meta-Analyze approach. Frontiers in
Psychology, 7:738. doi: 10.3389/fpsyg.2016.00738
- Cohen, J. (1962). The statistical power of abnormal-social psychological research: A review.
Journal of Abnormal and Social Psychology, 65, 145-153.
- Cook, T. D., & Campbell, D. T. (1979). Quasi-experimentation: Design and analysis issues for field settings. Boston, MA: Houghton Mifflin Company.
-
Cronbach, L. J., Ambron, S. R., Dornbusch, S. M., Hess, R.O., Hornik,
R. C., Phillips, D. C., Walker, D. F., & Weiner, S. S. (1980). Toward reform of program evaluation: Aims, methods, and institutional arrangements. San Francisco: Jossey-Bass.
- Devilly, G. (2005). Effect size generator. Retrieved from
http://www.swin.edu.au/victims/resources/software/effectsize/effect_size_generator.html
- Glass, G. V. (1976). Primary, secondary, and meta-analysis of research. Educational Researcher, 5, 3-8.
- Glass, G. V., McGraw, B., & Smith, M. L. (1981). Meta-analysis in social research. Beverly Hills: Sage Publications.
- Higgins, J. P., & Green, S. (2008). Cochrane handbook for systematic reviews of interventions. West Sussex, UK: John Wiley & Sons.
- Hodge, D. R. (2007). A systematic review of the empirical literature on intercessory prayer. Research on Social Work Practice, 17, 174-187. DOI: 10.1177/1049731506296170
- Hunter, J. E., & Schmidt, F. L. (1990). Methods of meta-analysis: Correcting error and bias in research findings. Newbury Park, CA: Sage Publications.
- Ioannides, J. P. A. (2016). The mass production of redundant, misleading, and conflicted systematic reviews and meta-analyses. Milbank Quarterly, 94, 485-514.
- Keng, L, & Beretvas, N. (2005 April). The effect of publication bias on correlation estimation. Paper presented at the Annual Meeting of the American Educational Research Association, Montreal, Canada.
- Liao, Y. C. (1998). Effects of hypermedia versus traditional instruction
on students' achievement: A meta-analysis. Journal of Research on Computing in Education, 30, 341-361.
- Olkin, I. (2000 November). Reconcilable differences: Gleaning insight from independent scientific studies. ASU Phi Beta Kappa Lecturer Program, Tempe, Arizona.
- O’Neil, C. (2016). Weapons of math destruction: How big data increases inequality and threatens democracy. Crown.
- Poston, J. M, & Hanson, W. E.(2010). Meta-analysis of psychological assessment as a therapeutic intervention.
Psychological Assessment, 22, 203-12.
- Prioleau, L., Murdock, M., & Brody, N. (1983). An analysis of psychotherapy versus placebo studies. Behavioral and Brain Sciences, 6, 275-310.
- Rothstein, R. (2001). The myth of public school failure. The American Prospect. https://prospect.org/education/myth-public-school-failure/
- Root, D. (2003). Bacon, Boole, the EPA, and scientific standards. Risk Analysis, 23, 663-668.
- Schwarz, C. (1998). Contingency tables - Simpson's paradox. Retrieved from
http://www.math.sfu.ca/stats/Courses/Stat-301/Handouts/node49.html
- Siegfried, T. (2010). Odds are, it's wrong: Science fails to face the shortcomings of statistics.
Science News, 177(7). Retrieved from
http://www.sciencenews.org/view/feature/id/57091/
- Skeptic's Dictionary. (2012). Meta-analysis. Retrieved from http://www.skepdic.com/metaanalysis.html
- Slavin, R. (2008). Perspectives on evidence-based research in education. Educational Researcher, 37(1), 5-14.
- Slavin, R., & Smith, D. (2008, March). Effects of sample size on effect size in
systematic reviews in education. Paper presented at the annual meetings of the Society for Research on Effective Education, Crystal City, VI.
- Smith, M. L., Glass, G. V., &. Miller, T. I. (1980). The benefits of psychotherapy. Baltimore, MD: Johns Hopkins University Press.
- Sohn, D. (1995). Meta-analysis as a means of scientific discovery. American Psychologist, 50, 108-110.
- Sohn, D. (1996). Meta-analysis and science. Theory and Psychology, 6, 229-246.
- Sohn, D. (1997). Questions for meta-analysis. Psychological Reports, 81, 3-15.
- StatDirect Inc. (2014). StatDirect [Computer Software]. Cheshire, WA: Author.
- Stajkovic, A. D., & Lee, D. S. (2001). A meta-analysis of the relationship between collective efficacy and group performance. Paper presented at the national Academy of Management meeting, Washington, DC.
- Sterne, J, & Egger M. (2001). Funnel plots for detecting bias in meta-analysis: Guidelines on choice of axis. Journal of Clinical Epidemiology, 54, 1046-1055.
- Stenger. V. J. (2007). God: The failed hypothesis. How science shows that God does not exist (Kindle Edition). Amherst, NY: Prometheus Books.
- Thompson, D. P. (2007). A meta-analysis on the efficacy of prayer.
Fresno, Alliant International University. Unpublished Dissertation.
- Wang, M. C., & Bushman, B. J. (1999). Integrating results through meta-analytic review using SAS software. Cary, NC: SAS Institute.
- Welkowitz, J., Ewen, R. B., & Cohen, J. (1982). Introductory statistics for the behavioral sciences. San Diego, CA: Harcourt Brace Jovanovich, Publishers.
- Wilkinson, L, & Task Force on Statistical Inference.
(1999). Statistical methods in psychology journals: Guidelines and
explanations. American Psychologist, 54, 594-604.
- Yu, C. H. (2012). Can absence of evidence be treated as
evidence of absence: An analysis of Victor Stenger's argument against
the existence of God. China Graduate School of Theology Journal, 52, 133-152.
Last update: 2022
 Go up to the main menu Go up to the main menu
|
|