Experimental design as variance control
Last updated: 2025
Variability
 Kerlinger (1986) conceptualized experimental design as variance
control.
The previous lesson has pointed out that control is an indispensable
element of experiment. The aspect of variance is discussed here. First
of all, let's spend a few minutes to look at the concept "variance" or
"variability".
Kerlinger (1986) conceptualized experimental design as variance
control.
The previous lesson has pointed out that control is an indispensable
element of experiment. The aspect of variance is discussed here. First
of all, let's spend a few minutes to look at the concept "variance" or
"variability".
The purpose of research is to maximize variance
explained and minimize error variance.
Using radio frequency as a metaphor to data, researchers want to filter
noise in order to get a clear signal. For example, F ratio in Analysis
of Variance (ANOVA) can be viewed as a ratio between signal and noise.
ANOVA is always used to compare several group means. Why isn't it
called Analysis of Mean instead of Analysis of Variance? It is because
the means are compared based upon variance. The F ratio in ANOVA is:
|
Variability between groups
|
|
Variability within groups
|
For the simplicity of illustration, now let's use only two groups.
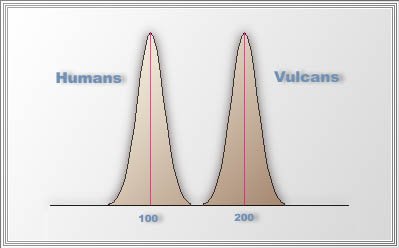
Suppose in the 24thcentury
we want to find out whether Vulcans or humans are smarter, we can
sample many Vulcans and humans for testing their IQ. If the mean IQ of
Vulcans is 200 and that of humans is 100, but there is very little variability
within each group, as indicated by two narrow curves in the
following figure, then the mean difference between two groups
sends a very clear signal that even the dumbest Vulcan has higher IQ
than the smartest human.
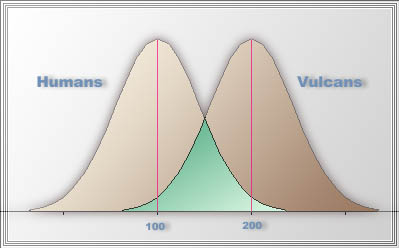
But what if there exist a huge within group variability in both
distributions, as shown in the following figure? In this case, the
answer is not clear cut. Some Vulcans are more intelligent than humans
and vice versa. Thus, within group variability is noise that distorts
the signal. The means must be compared by considering both between
group variability and within group variability.
Variance control
Within-group variability could be caused by many things. It could be a
real inherent dispersion among different people's abilities. But it
could also be a result of poor research design and measurement error.
Well-design design should accomplish the following goals: maximize
experimental variance, control extraneous variance, and minimize error
variance. Put it in the context of ANOVA as illustrated in the
preceding example, the goals of experimental design are maximizing
between-group variability (signal) and minimizing within-group
variability (noise).
Maximize experimental variance
Experiment variance is the variance of the dependent variable
influenced by the independent variable(s). To maximize experimental
variance, researchers should make experimental conditions as different
as possible. For example, if you design a research study to compare
Web-based instruction and conventional computer-based instruction, the
features of the two treatments must be pulled apart as much as
possible. The Web version must carry properties that cannot be found in
other media. If learning attribute is a factor in this study, the two
groups of learners must be extremely different on the aptitude
dimension. In other words, researchers expect to detect between-group
variability if it is present. Quite a few research studies on Web-based
instruction presented very similar versions of treatment to different
groups. Further, in those studies classification of user groups did not
reflect variability of learner aptitude. These mistakes should be
avoided.

|
"This is a
breakthrough in engineering science. Repeated experiments confirm that
a Porsche 911 can outrun a Honda Civic."
|
One should be cautious that the concept of "maximizing
experimental
variance" could be terribly misunderstood. Look at the following two
experiments:
- Engineer A wants to test the engine performance of
Porsche 911. He compares it against a Honda Civic.
- Engineer B wants to test the engine performance of
Porsche 911. He compares it against a Ferrari.
By common sense, most people will laugh at the first benchmark test and
approve the second one. But, look at the next pair:
- Researcher A spent 100 hours to develop a
Web-based course as the treatment. He simply printed out a hard copy of
those WebPages in half an hour for the control group.
- Researcher B spent 100 hours to develop a Web-based
course as
the treatment. He also invested a lot of efforts to develop a
multimedia version for the control group.
 What Researcher A did is very similar to what Engineer A
did. Very often educational research is a comparison between a Porsche
911 and a Honda Civic. i.e. the treatment and the control groups are
not comparable at all. While criticizing the lack of evidence-based
research and decisions in education, Slavin (2008) cited a real-life
example: Once a series of studies were conducted to evaluate Daisy
Quest, a computerized program used to teach phonemic
awareness in Grades K through I. The results were said to be positive,
but in the studies (e.g., Barker & Torgesen, 1995), the control
groups were not taught phonemic awareness at all. Besides the design
issue, there is a measurement issue associated with the preceding
problem. Slavin pointed out that the developer-made tests are intended
to assess the outcomes taught in the treatment program, and such tests
are unfair to the control group. Needless to say, test scores show the
superiority of the treatment group and the null hypothesis could be
easily rejected.
What Researcher A did is very similar to what Engineer A
did. Very often educational research is a comparison between a Porsche
911 and a Honda Civic. i.e. the treatment and the control groups are
not comparable at all. While criticizing the lack of evidence-based
research and decisions in education, Slavin (2008) cited a real-life
example: Once a series of studies were conducted to evaluate Daisy
Quest, a computerized program used to teach phonemic
awareness in Grades K through I. The results were said to be positive,
but in the studies (e.g., Barker & Torgesen, 1995), the control
groups were not taught phonemic awareness at all. Besides the design
issue, there is a measurement issue associated with the preceding
problem. Slavin pointed out that the developer-made tests are intended
to assess the outcomes taught in the treatment program, and such tests
are unfair to the control group. Needless to say, test scores show the
superiority of the treatment group and the null hypothesis could be
easily rejected.
There is another similar real-life example in medical
science. A study suggested that patients taking the anti-depressant,
Paxil, had a higher rate of suicidal incidents than patients in the
placebo group. Another study showed that patients taking another
anti-depressant, Proaz, had fewer suicidal incidents than the placement
group. But actually the rate of suicidal incidents in the Proaz group
was higher than that in the Paxil group. If that is the case, then how
could Proaz appear to be safer than Paxil? The truth is: there are two
different placebo groups. In the Paxil experiment, fewer patients on
placebo had suicidal incidents than those on placebo in the Proaz
experiment (Siegfried, 2010). It does not mean that the researchers in
the Proaz experiment selected an at-risk group on purpose. However, it
is obvious that how good the result is depends on what the control
group is.
The ethics of clinical research requires equipoise,
which is a state of genuine uncertainty on the part of the clinical
researcher regarding the treatment effectiveness of each side in a
trial. In other words, it is unethical for a medical researcher to
assign patients into the control group when he/she has known that the
treatment is much more effective than the control (Freedman, 1987). By
the same token, educational researchers should never conduct a study in
which the control/comparison group is absolutely inferior to the
treatment.
There are documented instances in research history
where participants were intentionally given inferior treatments or
placed in "do-nothing" control groups, leading to devastating
consequences for their lives. AZT research for HIV in developing
countries during the 1990s is an infamous example. In trials testing
the effectiveness of antiretroviral
drugs to prevent mother-to-child transmission of HIV, researchers in
some developing countries used placebo control groups instead of the
existing standard treatment in wealthier nations. Women in the placebo
groups received no treatment, resulting in preventable HIV transmission
to their newborns (Zion, 1998). .
People misunderstood that "maximizing the between
group difference"
is to deliberately make the control group inferior or irrelevant.
Actually, the meaning of "maximizing the experimental variance" is to
make the best out of both groups. If I want to see the true difference
between a Porsche and a Ferrari, I should fine tune both engines to the
peak level. In the same fashion, if I want to see the true difference
between Web-based instruction and conventional instruction, I should do
my best to make both versions well written and well-organized.
Control extraneous variance
- To exclude the extraneous variable:
If you worry that
variability of intelligence among subjects may affect the experiment,
you can select subjects whose IQ is between 90 to 100, which is
considered normal. Please be cautious that this approach may hinder the
researcher from making a broader generalization.
For example, when an experiment is conducted to
compare test
performance between users of Web-based instruction and conventional
instruction, a significant mean difference may be observed among
average IQ subjects, but not among high IQ subjects. If no high IQ
subjects are recruited, the researcher cannot assert that Web-based
training works better than conventional teaching for high IQ people.
There are many dimensions in which people can
differ from each other.
It is not a bad idea to exclude just one or a few extraneous variables,
but still include several factors simultaneously in the experiment.
However, a beginner in research may use a "one-at-a-time" approach or
"holding other constant" approach to test the interested variable only.
This simple approach does not require experimental design, but it fails
to examine interaction effects among different factors and thus insight
may be missed.
- Randomization: Through
randomization, high, medium,
and low IQ subjects can be spread evenly in the control group and the
treatment group. However, when the sample size is small, randomization
may lead to Simpson's paradox, which was discussed earlier.
- To include the extraneous variable as a
factor or a covariate: A statistical technique called Analysis
of Covariance (ANCOVA) can be employed to adjust the
pre-existing differences introduced by the extraneous variable such as
IQ and GPA.
- Matching subjects: Find subjects
in pair who have
matched characteristics in extraneous variables. This method is
commonly used in case-control studies. For example, in a study that
aims to identify factors of illegal drug use at schools, it is
extremely difficult, if not impossible, to recruit students who admit
using illegal drug. A viable approach is to carpeting all the students
in a school using anonymous surveys. It turns out that 50 out of 1,000
students report drug use. If these 50 cases are compared against 950
controls (no drug use), needless to say the variances of the two groups
are extremely asymmetrical, thus violating the assumptions of most
parametric tests. To make a valid comparison, 50 non-drug users are
selected from the sample by matching the demographic and psychological
characteristics of the 50 cases (Tse, Zhu, Yu, Wong, & Tsang,
2015).
- Repeated measures: While
matching subjects in all relevant attributes is difficult, there is a
way to do easy matching. The most matching person to anyone in all
attributes is the same person. Based on this logic, the researcher can
employ a repeated measures design (RMD), in which each subject becomes
his or her own control. The simplest form of RMD is a pretest-posttest
design, which has two measures only, but it is common for researchers
to have multiple measures in a longitudinal study. There are many ways
to analyze RMD data, namely, GLM repeated measures, Structural Equation
Modeling, and Multilevel Modeling (also known as Hierarchical
Linear Modeling, HLM),
HLM is considered the best. ANOVA/GLM repeated measures is limited by
its assumption of a single covariance structure, namely, compound
symmetry. On the other hand, multi-level modeling allows different
covariance matrix structures, such as auto-regressive, Toeplitz,
heterogeneous AR, heterogeneous compound symmetry, and many others. In
addition, multi-level modeling uses maximun likelihood estimation,
which is more accurate than the sum of squares approach in GLM.
Further, the goodness of a mixed-level model could be evaluated by
multiple fitness criteria, namely, Akaike Information Criterion (AIC),
Bayesian Information Criterion (BIC), AAIC, and so on (Shin, Epsin,
Deno, & McDonnell, 2004).
Reduce error variance
Error variance is uncontrollable variance. The source of error variance
can be guessing, momentary inattention, bad mood...etc.
- Blocking: If all subjects are
treated as a big group, the
within-group variability may be very huge. By dividing the experimental
conditions into several "blocks", the researcher can localize error
variance i.e. in each block the within-group variability is smaller.
For example, in an experiment a researcher collected the data in two
days. He worried that this might produce uncontrollable noise and thus
include day of run as a blocking factor in the design (Montgomery,
1997). In a quasi-experiment studying the effect of Web-based
instruction, data may be collected in three separate classes. Again, we
cannot neglect that different instructors and different conditions in
those classes may affect the outcome of the study. In this case, class
can be used as a unit of blocking.
- Improve the reliability of measure:
If the
instrument has a high reliability coefficient, there will be less
measurement error and thus error variance is reduced. Reliability will
be discussed in the section "Measurement."
Less is more
In the light of variance control, researchers should avoid designing a
complex experiment prematurely. The more complicated the design is, the
more noise the design has. American Psychological Association (1996)
endorses the use of minimally sufficient designs and analytic
strategies:
The
wide array of quantitative techniques and the vast number of
designs available to address research questions leave the researcher
with the non-trivial task of matching analysis and design to the
research question. Many forces (including reviewers of grants and
papers, journal editors, and dissertation advisors) compel researchers
to select increasingly complex ('state-of-the-art,' 'cutting edge,'
etc.) analytic and design strategies. Sometimes such complex designs
and analytic strategies are necessary to address research questions
effectively; it is also true that simpler approaches can provide
elegant answers to important questions. It is the recommendation of the
(APA) task force that the principle of parsimony be applied to the
selection of designs and analyses. The minimally sufficient design and
analysis is typically to be preferred because:
- it
is often based on the fewest and least restrictive assumptions,
- its use is less prone to errors of application,
and errors are more easily recognized, and
- its results are easier to communicate--to both
the scientific
and lay communities. This is not to say that new advances in both
design and analysis are not needed,
but simply that newer is not necessarily better and that more complex
is not necessarily preferable.
Reading
The concept "variance" is fundamental in understanding experimental
design, measurement, and statistical analysis. It is not difficult to
understand ANOVA, ANCOVA, and regression if one can conceptualize them
in the terms of variance. Kerlinger (1986)'s book is a good start.
To go beyond the basic, one should contemplate the
concept
"orthogonality," which is important to both ANOVA and regression. In
ANOVA when group sizes are balanced, the design is said to be
orthogonal. In regression when predictors are not inter-related, they
are also said to be orthogonal. Experimental design could be
conceptualized as model building.
In this sense, relationships among variables are specified to form a
model. "Non-orthogonal" variables are detrimental to from a sound
model. A Director program entitled "Collinearity:
A question of support,"
which was developed by myself, David Winograd, Sandra Andrews, Samuel
DiGangi, and Angel Jannasch (1999), explains both "variance" and
"orthogonality" in layman terms. A web version entitled "Mutli-collinearity,
orthogonality, variance inflation factor" (Yu, 2016), which
carries more detail, is also available.
References
- American Psychological Association. (1996). Task
Force on Statistical Inference Initial Report. Retrieved from http://www.apa.org/science/tfsi.html
- Barker,
T. A., & Torgesen, J. K. (1995). An evaluation of computer
assisted
instruction in phonological awareness with below average readers. Journal
of Educational Computing Research, 13, 89-103.
- Freedman, B. (1987). Equipoise and the ethics of
clinical research. New England Journal of Medicine, 317,
141-5.
- Kerlinger, F. N. (1986). Foundations of
behavioral research. New York: Holt, Rinehart and Winston.
- Montgomery, D. C. (1997). Design and
analysis of experiment. New York: Wiley.
- Shin, J., Espin, C. A., Deno, S., McConnell, S.
(2004).
Use of hierarchical linear modeling and curriculum-based measurement
for assessing academic growth and instructional factors for students
with learning difficulties. Asia Pacific Education Review, 5,
136-148.
- Slavin, R. (2008). Perspectives on evidence-based
research in education. Educational Researcher, 37(1),
5-14.
- Siegfried, T. (2010). Odds are, it's wrong: Science
fails to face the shortcomings of statistics. Science News,
177(7). Retrieved from
http://www.sciencenews.org/view/feature/id/57091/
- Tse, S., Zhu, S., Yu, C. H., Wong, P., &
Tsang, S.
(2015). An ecological analysis of secondary school students' drug use
in Hong Kong: A case-control study. International Journal of Social
Psychiatry, 10. DOI: 10.1177/0020764015589132.
Retrieved from http://isp.sagepub.com/content/early/2015/06/08/0020764015589132.full.pdf?ijkey=LsS6bpT9BsYOcpY&keytype=finite
- Yu, C. H. (2016). Multi-collinearity,
variance Inflation, and orthogonalization in regression.
Retrieved from http://www.creative-wisdom.com/computer/sas/collinear.html
- Yu, C. H., Winograd, D., Andrews, S., DiGangi, S.
&
Jannasch-Pennell, A. (1999). Visualizing collinearity , variance
inflation factor, and orthogonalization in subject space. American
Statistical Association 1988 Proceedings of the Section on Statistical
Education, 119-124.
- Zion, D. (1998). Ethical considerations of clinical
trials to prevent vertical transmission of HIV in developing countries.
National
Medicine, 4(1), 11-12. doi: 10.1038/nm0198-011.
 Go up to the main menu Go up to the main menu
|
|