True score model and item response theory
True score model
True score model (TSM) is also called classical test theory (CTT) for its history could be traced back to Spearman (1904). The equation of TSM is expressed as:
X = T + E
where
X = fallible, observed score
T = true score
E = random error
Ideally, the true score reflects the exact value of the respondent's ability or attitude. The theory assumes that traits are constant and the variation in observed scores are caused by random errors, which resulted from numerous factors such as guessing and fatigue. These random errors over many repeated measurements are expected to cancel out each other (e.g. sometime the tester is so lucky that his observed scores are higher than his true scores, but sometimes he is unlucky and his observed scores are lower). In the long run, the expected mean of measurement errors should be zero. When the error term is zero, the observed score is the true score:
X = T + 0
X = T
Therefore, if an instrument is reliable, the observed scores should be fairly consistent and stable throughout repeated measures. Many popular reliability estimate methods such as spilt-half, Cronbach coefficient alpha, test-retest and alternate forms are based upon this rationale. These procedures will be explained in a later lesson.
Item response theory
 TSM does not provide information about how testers at different ability levels perform on the item. Item response theory (IRT) was developed to overcome the preceding shortcoming. In IRT a test is unbiased if all testers having the same skill level have an equal probability of getting the item correct regardless of group membership. TSM does not provide information about how testers at different ability levels perform on the item. Item response theory (IRT) was developed to overcome the preceding shortcoming. In IRT a test is unbiased if all testers having the same skill level have an equal probability of getting the item correct regardless of group membership.
IRT is also called latent trait theory because the theory assumes the existence of a latent trait, which is a tester characteristic that leads to a consistent performance on a test.
Currently there are several software packages that are capable of performing IRT analysis. This article will introduce three of them: Winsteps, Systat, and Bilog. Winsteps is limited to run the
Rasch model only. Although Winsteps is restrictive, certain output tables are very helpful (see the left figure). For example, the map of students and items illustrates the tester ability and the item difficulty side by side. Using this table, the test developer could perceive the overall picture of the test at one glance.
Systat can analyze test items for one- and two- parameter models. To perform the analysis, go to Statistics--Test Item Analysis--Logistic. A numeric output and a Latent Trait Model Items Plots will be produced as shown in the following:
The horizontal axis of the plots denotes the latent trait, the vertical axis is the proportion of examines responding correctly, and the curve is called the item characteristic curve (ICC) . According to IRT, if the item is well-written, the ICC should be a normal ogive--the shape of the curve looks like that of a half bell-curve. In the above example, Question 1 to 3 resemble a normal ogive while Question 4 does not.
Systat provides not only examples, but also the explanation of examples. In Help--Search help on, enter "Test item analysis" to pull out an example as the following:
On each step of the example output, you can push the "discussion" button to learn the meaning of the output:
However, as mentioned before, SyStat's IRT procedures include one- and two-parameter models only. For running three-parameter model, Bilog (Mislevy & Bock, 1990) is a popular choice. The Bilog's manual also has an
introduction to models with different numbers of parameters.
Besides Bilog, JMP (SAS Instutite, 2007) can also handle 3-parameter IRT
modeling. Although JMP has nice graphical user face and its learning curve is
not as steep as that of Bilog, please notice that JMP is a general-purposed
statistical package rather than a specialized assessment tool, and thus its IRT
information is limited. Nevertheless, for those who want immediate reports
without going through scripting and programming, JMP is a good start. Also, as a
general package, JMP allows you to do other things, such as descriptive and
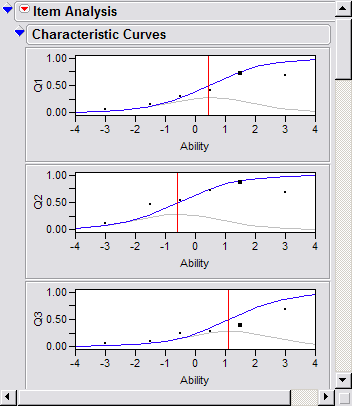
inferential statistics. The following are ICCs and item parameters output from JMP:
 |
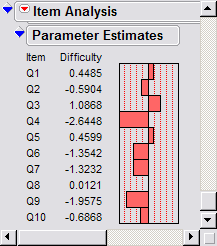 |
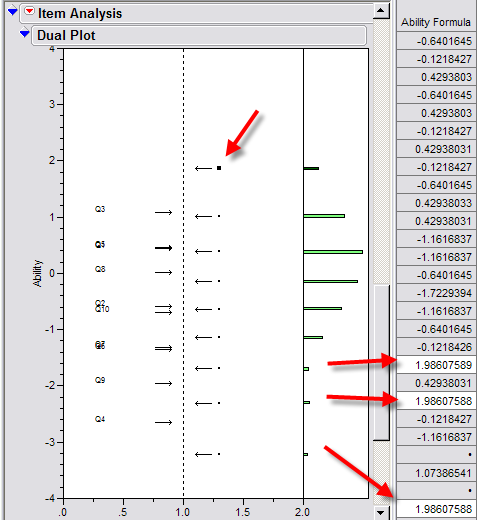
One of the useful features in JMP's IRT modeling is dual plot, in which the
attributes of all items and students are compared side and side. JMP's graphs
are dynamic and interactive. If you want to identify the students whose ability
is above average ( > 0), you can select the points and the corresponding rows in
the spreadsheet are highlighted simultaneously.
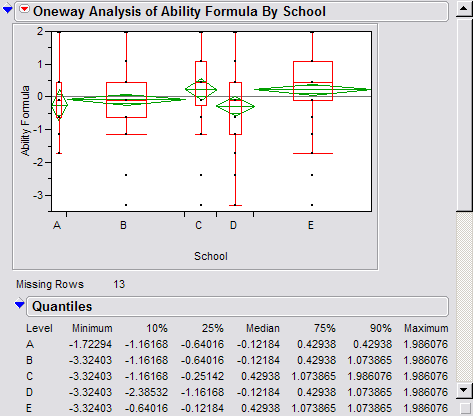
As mentioned above, JMP is a general-purpose statistical package. In addition to
item analysis, the psychometrician can also use JMP to perform other procedures,
such as examining whether there is a significant difference between schools in
terms of ability estimates yielded from IRT. The following is an example of
school comparison using confidence intervals (the
green diamonds). For more information, please consult the write-up entitled
JMP for Quick IRT results.
 . .
Differential item functioning
Based on IRT, should the instrument developer know whether examinees of the same ability but from different groups have different probabilities of success on an item? Put simply, is the test bias against particular gender, ethnic, social, or economic groups? Differential item functioning (DIF) was developed to counteract test item bias. DIF tells you whether the test item functions differently to different groups. There are two types of DIF:
- Uniform: The difference of the probability of success between groups is consistent across all levels of ability. For example, the item favors all males regardless of ability.
- Non-uniform: The difference of the probability of success between groups is not constant across ability levels. In other words,
there is an interaction effect between group membership and ability. For example, the item favors males of low ability while favoring females of higher ability.
There are two major approaches to estimate DIF, namely, Mantel-Haenszel (MH) procedure (Holland & Thayer, 1988) and logistic regression (Swaminathan & Rogers, 1990). However, please keep in mind that they can estimate test bias only and by no mean can replace the actual DIF calculation. For a thorough DIF analysis, one could use Bilog MG (SSI Central, 2000) or Winsteps (Rasch measurement software & publications, 2002)
Nevertheless, logistic regression and MH procedure are easier to compute and available in many statstics packages. Logistic regression is sensitive to non-uniform DIF while MH procedure isn't. Both procedures can be performed in SAS's PROC FREQ and PROC LOGISTIC. Examples are given as the following:
MH procedure
MH procedure is based on chi-square statistics. First, one should classify the ability level of examinees in terms of their score interval. In the following hypothetical example, 41 subjects whose total scores are high are grouped as the high ability group. Second, the command sytax PROC FREQ; TABLES ITEM1 * GENDER /CHISQ is issued to produce the following output:
The table shows that more females gave the right answer than males did. Is this difference significant enough to be considered as an item bias? Yes, the MH Chi-square, which is highlighted in the following figure, indicates that this difference is significant, p = .02.
Logistic regression
Logistic regression is a type of regression procedure in which the dependent variable is binary (1,0). This is suitable to test item analysis when the possible score is either one or zero. The purpose of computing a regression model is to examine whether the independent variable could predict the outcome. If being a male or a female does not predict the test score, the test item is "gender-free,' otherwise, gender has an effect on the test score.
Again, in this example 41 subjects are gathered as high ability group. The independent variable, or the predictor, is the group membership (gender). Because gender is a categorical variable, it does not make sense to assign a numeric value to gender. Instead, gender should be coded as a dummy variable to indicate the group membership. A variable named "male" is created. Testers who belong to this group are
labeled as "1", otherwise, "0." There is no need to create another variable for "female" because "male" and "female" are orthogonal (independent). If one is not a man, one must be a woman, of course.
Next, the command syntax PROC LOGISTIC; MODEL ITEM1 = MALE is used to estimate the logistic regression model. The following output is produced:
The logistic model returns a parameter called odds ratio, which is the ratio of the probability that an outcome (O) will occur divided by the probability that the same outcome will not occur:
Odds(O) = Pr(O)/[1 - Pr(O)]
In this example, the odds of giving the wrong answer is about 4.6 times higher for a male than for a female. The Wald Chi-square statistics is 5.25, which is statistically significance (p <= 0.022).
Criticism
Although TSM has been the dominant theory guiding estimation of instrument reliability and IRT is also gaining popularity, there are challengers to both models.
True score model
For example, Wilson (1998) stated that the true score model is a only mathematical abstraction. Under this model, errors are
indicated by the discrepancy between estimates, not between estimates and the hypothetical true score. If the true score doesn't exist in the real world and cannot be measured directly, the score should not be regarded as "true."
Wilson's notion is concerned with the existence of mathematical reality. A detailed discussion can be found in Yu (1999). Wilson is also critical to IRT. Please read his original paper for more detail.
DIF
Hills (1999) is critical to DIF. He stated that in last 20 years of DIF research (e.g. Roznowski & Reith, 1999), it has never been demonstrated that removing biased items could remove the test bias and bring mean scores together. An exception is the differences
in mean scores on intellectual tests for males and females, where the differences were very small in the first place. Thus, DIF doesn't exist in any useful way and does not function as it was initially proposed to function.
In a similar vein, Reise and Flannery (1996) asserted that in personality
psychology the "bark" of the response bias was worse than its bite.
Further, DIF can detect item bias if and only if the following assumptions are true:
- It is assumed that test items measure a single trait. What if there are
multiple traits behind the scene? For example, a math test may consist of items in both numeric and essay forms. A tester who is low in math skill but high in reading skill may answer difficult math questions expressed in a numeric form correctly, but fail to answer easy questions expressed in an essay form. This dual-trait situation is unavoidable because almost all tests require reading skills.
However, when a skill involves multiple traits other than the content and the language, say A and B, DIF may not be useful. The test item may bias against male on A, but bias against female on B.
- It is assumed that the overall test is fair and only several items are biased. Therefore the total score is used as a reference to classify testers into high and low ability group. However, what if more than half of the items are biased?
- It is assumed that abilities are equivalently distributed across groups. Therefore, certain test score differences are due to unfair questions rather than inherent group differences. Challengers to this assumption are always criticized as "racist," "sexist," or some type of narrow-minded people. However, whether certain groups have inherent advantages on certain tasks should be open to scientific investigation rather than settling down by political correctness.
Irrelevant side track
Once upon a time there was a hypothetical nation named XYZ. Since a few decades ago, a high percentage of young people in this nation have been consuming alcohol and illegal drugs heavily. Several scientists investigated the long term effect of this trend. They suggested that since both alcohol and drugs kill brain cells, this behavioral pattern might eventually alter the genetic structure of this race after several generations. The evidence presented by these scientists was lower academic scores of their own young people in international contests. Later, the project was closed because it was believed that there should be no inherent group difference in academic performance, and the score differences should be due to biased testing methodologies.
Once upon a time there was another hypothetical nation named ABC. ABC has a wide diversity of ethnic groups. The ABC government maintained that education and employment opportunities must be equal across all ethnic groups. Failures to achieve racial equality were attributed to biased tests. It was argued that most tests used in ABC favored green people but biased against blue people, because green people were the majority and the tests were based on their language and culture. However, East Asians such as Chinese, Japanese, and Korean, who were unfamiliar with the green language and culture, outperformed both the green and blue group on the average. Several scientists conducted research to examine whether test bias could explain test performance difference across ethnic groups. Later, the project was closed because it was perceived as a threat to political and economic equality.
|
Further reading
For a comprehensive overview of both classical test theory and item response theory, please consult Crocker and Algina (1986).
For an introduction to test bias analysis, please read Osterklind (1983).
For a non-technical introduction to item response theory, please consult Ryan (1983, 1985).
Students who are interested in the technical aspect of IRT may read Hambleton, Swaminathan, & Rogers (1991).
References
- Mislevy, R., Bock, R. D. (1990). Bilog: Item analysis and test scoring with binary logistic models. Mooresville, IN: Scientific Software.
- Crocker, L. M., & Algina, J. (1986). Introduction to classical and modern test theory. New York : Holt, Rinehart, and Winston.
- Hambleton, R. K., Swaminathan, H., & Rogers, H. J. (1991). Fundamentals of item response theory. Newbury Park, CA. : Sage Publications.
- Holland, P. W., & Thayer, D. T. (1988). Differential item performance and the Mantel-Haenszel Procedure. In H. Wainer, & H. I. Braun (Eds.), Test validity (pp. 129-145). Hillsdale, NJ: Lawrence Erlbaum.
- Hills, J. (1999, May 14). Re: Construct validity. Educational Statistics Discussion List (EDSTAT-L). [Online]. Available E-mail: edstat-l@jse.stat.ncsu.edu [1999, May 14].
- Holland, P. W., & Wainer, H. (Eds.). (1992). Differential item functioning : Theory and practice. Hillsdale : Lawrence Erlbaum Associates, 1992.
- Osterlind, S. (1983). Test item bias. Newbury Park: Sage Publications.
- Rasch Measurement Software & Publications. (2002). Winsteps. [On-line] Available URL: http://www.winsteps.com
- Reise, S., & Flannery, W. P. (1996). Assessing person-fit on measures of
typical performance. Applied Measurement in Education, 9, 9-26.
- Roznowski, M. & Reith, J. (1999). Examining the measurement quality of tests
containing differentially functioning items: Do biased items result in poor measurement? Educational & Psychological Measurement, 59, 248-271.
- Ryan, J. (1983). Introduction to latent trait analysis and item response theory. In W. E. Hathaway (Ed.). Testing in the schools: new directions for testing and measurement, no. 19 (pp. 49-65). San Francisco, CA: Jossey-Bass.
- Ryan, J. (1985 February). A non-technical comparisons of various measurement models. Paper presented at the Annual Meeting of the Eastern Educational Research Association, Virginia beach, VA.
- SAS Institute. (2007). JMP [Computer software and manual]. Cary, NC: The Author.
- Spearman, C. (1904). General intelligence: Objectively determined and measured. American Journal of Psychology, 15, 201-293.
- SSI Central, Inc. (2000) Bilog MG. [On-line] Available URL: http://www.ssicentral.com
- Swaminatham, J. & Rogers, H. J. (1990). Detecting differential item functioning using logistic regression procedures. Journal of Educational Measurement27, 361-370.
- Wilson, N. (1998). Educational standards and the problem of error. Education Policy Analysis Archives, 6(10). [On-line] Available:
http://olam.ed.asu.edu/epaa/v6n10/.
- Yu, C. H. (1999). Mathematical reality: Does theoretical distributions exist? [On-line] Available: http://www.creative-wisdom.com/computer/sas/math_reality.html.
Last updated: April 2008
 Go up to the main menu Go up to the main menu
|
|